How preferencial al preferencial trade agreements? Disentangling market access effects of preferential trading arrangements
De FUNDACION ICBC | Biblioteca Virtual
Almost every country in the world is engaged in at least one preferential trading arrangement (PTA), and the World Bank (2005) estimates that the average WTO member is engaged in six. In addition, the major OECD trading partners are engaged in non-reciprocal preferential access schemes (the so-called “Trade Preferences for Development”) through the Generalised System of Preferences (GSP) and more recently the “Everything but Arms” (EBA) initiative for the EU and the African Growth Opportunity Act for the US, both giving duty-free-quota-free market access. Simultaneously the US and the EU are engaged in multiple PTA negotiations, sometimes with other PTA groups rather than single partners.
An important issue for trading partners is to know how much they are “giving away” or “receiving” in preferential access and to have a compact representation of this “effective” market access. This column presents a graphical approach to displaying effective market access and applies it to the recent proposed ASEAN-EU PTA.
Representing effective market access
Assume that we are interested in the market access ASEAN countries would get under a PTA with the EU. Usually, preferential access is measured as the difference (expressed in %) between the tariff faced by an MFN exporter (i.e. an exporter that trades with the EU on a MFN basis without any preferential scheme) and the tariff faced by an ASEAN member when it exports to the EU. Thus, the preferential margin is zero for products with zero MFN tariffs.
However, as first pointed out by Low et al. (2005), for countries like the EU (and US) that extend preferential access to many trading partners, one should measure the preferential access against the effective tariff paid by all other exporters to the EU at that tariff line level rather than against the MFN tariff. Call this measure the adjusted preferential access measure (Low et al. call it the “competition-based preferential access” measure). According to this measure, a country like Singapore that currently pays the MFN tariff on its exports to the EU receives less market access than competing exporters to the EU and then gets a negative preferential margin, unless all other countries selling to the EU for that tariff line are also MFN exporters. Of course, this adjustment is useful insofar as there is some competition across partners, which is probably likely, even at the HS-10 tariff level (HS-10 being the EU Harmonised system of imports classification including 12,145 products or tariff lines). Aggregating across products gives the overall adjusted preferential access for a country.
But negotiators also want to know if the change in effective market access is for products that count, i.e. if it reflects a small or large “value” for these preferences. They want to know if the resulting change in market access affects HS-10 products with negligible market share (nothing can be surmised about developments at the extensive margin from an impact analysis based on current market shares). Or they might want to know if products that are candidates for exemption from preferences during the negotiation count a lot. We propose a “new” Lorenz-like representation of the distribution of preferential access across products (Carrère et al. forthcoming). We take the top 100 products ranked by decreasing shares in total exports and plot them against the cumulated preferential market access, unadjusted or adjusted. The adjusted market access measure is normalised by the cumulative market access, so that the cumulative sum of adjusted market access across the top 100 products sums to 1 (since the top 100 products do not add to all exports, the horizontal axis does not add up to 100% so the resulting curve is not exactly a Lorenz curve).1 This Lorenz-like representation is convenient. Just like a standard Lorenz curve depicting the extent of income inequality, the more convex the curves, the more skewed preferences are towards products that count little in the total value of exports.
ASEAN-EU PTA: Who is getting market access?
Although the proposed ASEAN-EU PTA may be about more than market access, preferential access to trading partners remains among the primary objectives on both sides and was clearly mentioned when negotiations were launched. The issue for ASEAN members is that they are a heterogeneous group that will be affected very differently by a PTA with the EU. Indeed, except for Singapore, all ASEAN members get some preferential access to developed-country markets. The three low-income countries in ASEAN, Cambodia, Laos, and Myanmar, benefit from the “Everything but Arms” scheme that gives them duty-free-quota free access to the EU. A second group that includes Brunei, Indonesia, Malaysia, Philippines, Thailand, and Vietnam gets the standard Generalised System of Preferences granted by the EU. It is thus clear that the proposed PTA with the EU will erode preferences on some products for the low-income countries in ASEAN vis-à-vis other ASEAN members. In relative terms, at least, ASEAN partners without EBA preferences will gain market access.
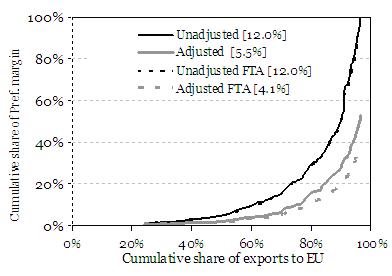
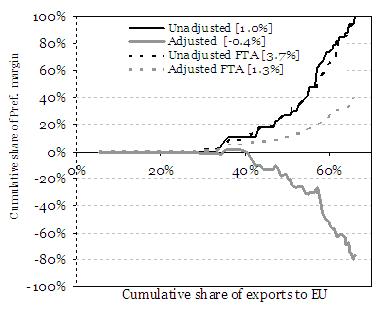
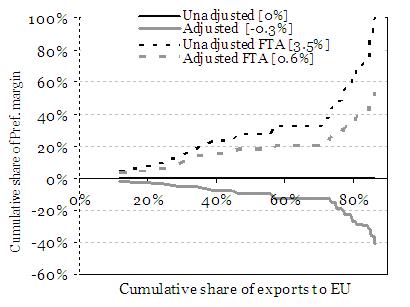
Figure 1 contrasts the extent of market access for an EBA exporter (Cambodia), a GSP exporter (Indonesia), and the sole MFN exporter (Singapore). For each one of the three selected countries, the figure gives the weighted (by export shares) average unadjusted and adjusted preferential market access in brackets. In all cases, the curves become very steep as one approaches the last ten products or so. Those are the products that would gain the most preferential access but they are also currently negligible in the export basket, never reaching 3% of export value. This pattern reflects the workings of political-economy motives in the determination of rent transfers granted through preferential market access – tariff preferences are granted to sectors and products in which they face little competition, i.e. usually to sectors and products that export negligible amounts to the EU.
Figure 1. Cumulative exports against cumulative preferences
(HS-10 digit items to the EU25 in 2004)
Average unadjusted and adjusted preferential market access weighted by export shares in brackets
Cambodia
Indonesia
Singapore
The black and gray curves in Figure 1 are the unadjusted and adjusted curves respectively. The distance between the current adjusted and unadjusted lines (solid ones) indicates the extent of erosion due to competition by other preference-receiving countries in the current situation. The distance between the gray solid and gray dashed lines indicates the extent of loss/gain in terms of the adjusted preferential margin when implementing the proposed FTA between the EU and ASEAN countries. According to Figure 1, there is a clear loss for Cambodia (the EBA country) and gains for Indonesia (GSP) and Singapore (MFN). Going a step further and comparing the patterns across EBA and GSP ASEAN exporters would show that the EBA group is quite homogenous in ASEAN, but not the GSP group, so the former would form a natural negotiating group but not the latter (see details in Carrère et al. forthcoming).
Implications
These measures of market access suggest that ASEAN members will face very different outcomes when negotiating as a group with the EU or US, which have extensive trade preference programmes. This diversity is also likely to be present in other countries negotiating PTAs, such as the “Economic Partnership Agreements” or negotiations for LDCs’ market access under the Doha round (see Carrère and de Melo 2009). In the case of ASEAN, even the EBA beneficiaries’ effective market access is cut in half once EU preferential access to other partners is taken into account. The small aggregate value of preferences captured by the “Lorenz-like” curves in the export/preference-margin space show clearly that preferences are always received for products with very small export shares.


